MXM FX Curve manual
Source code on GitHub · Questions on Discord
This manual explains how to draw and chain curves in MXM FX Curve, then goes through the controls around the canvas. What every MXM editor shares, such as presets, zoom, themes and the keys, is in Using the MXM editors.

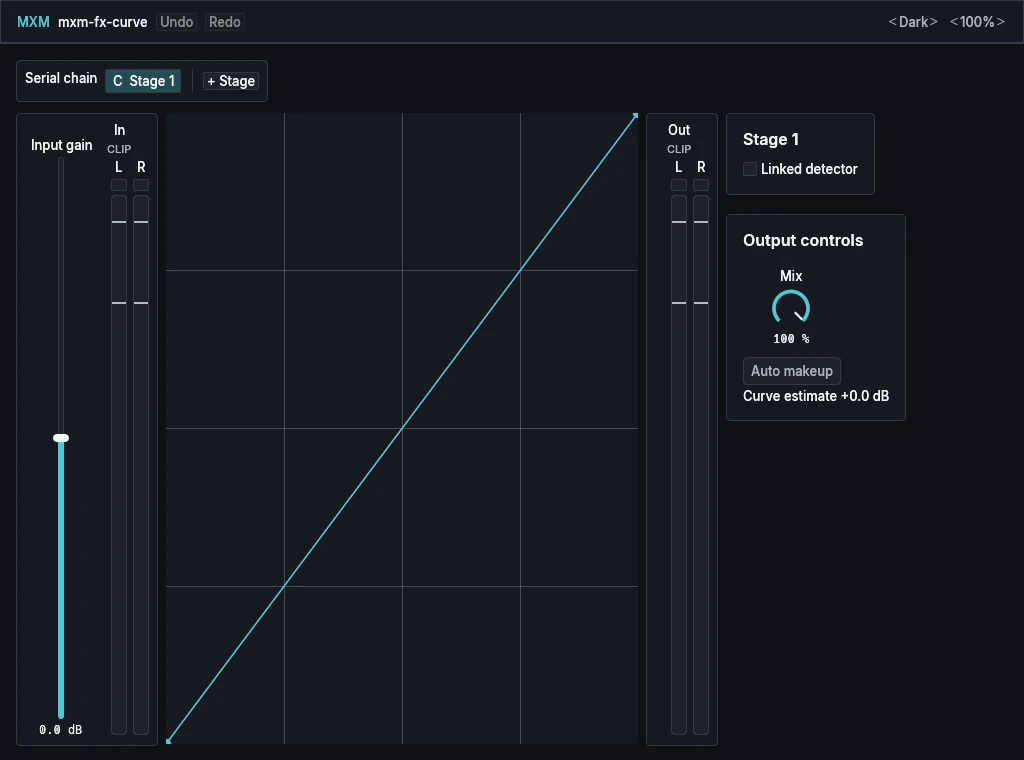
The editor is a canvas, not a set of pages. Along the top runs the serial chain. Below it, from the left: the Input gain fader and the In meter, the canvas, the Out meter, and a column holding the Stage card and the Output controls card. The canvas takes all the room left over, so a larger window gives you a larger curve to draw on. Below 840 wide the canvas and the controls stack, and the editor scrolls.
The signal runs through Input gain, then each stage in order from left to right, then Auto makeup, and Mix blends the result with the untouched input.
App bar
Besides the shared preset row, Theme and Scale, the app bar has Undo and Redo. Undo takes back one whole edit of the curves: a point moved, a stage added, removed or moved. It holds 64 steps, keeps them when you close and reopen the editor, and is cleared by loading a preset or the host restoring a project. Ctrl+Z undoes, and Ctrl+Shift+Z or Ctrl+Y redo (Cmd on a Mac). There is no level meter in the app bar; the In and Out meters stand beside the canvas.
Serial chain
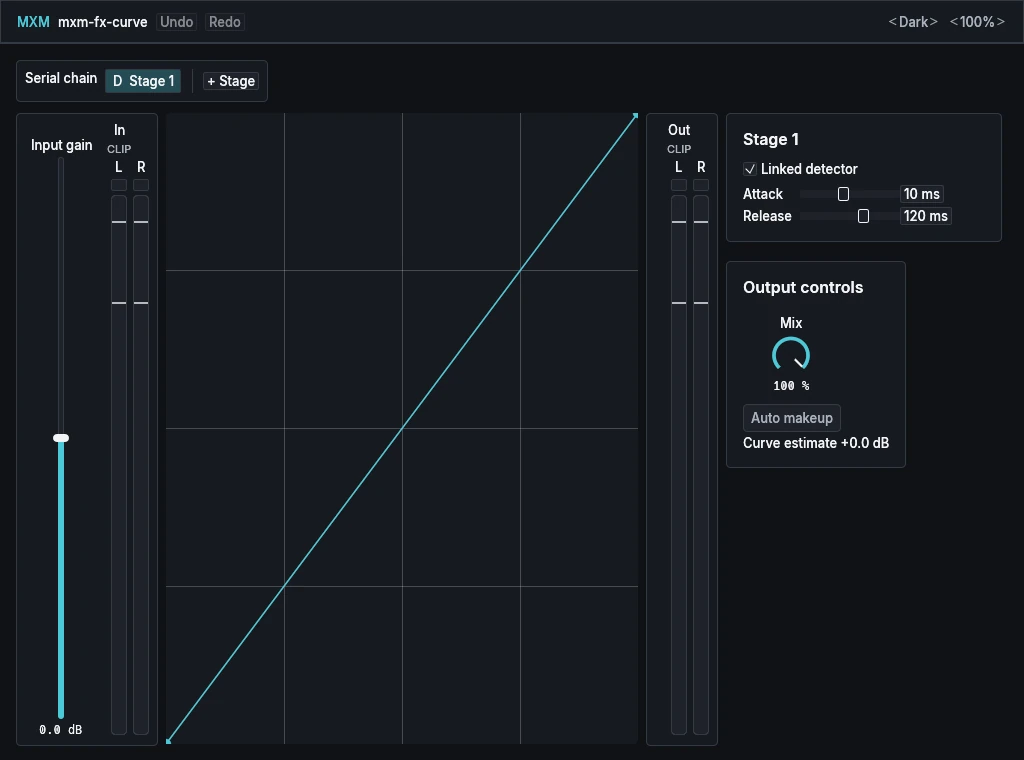
The strip at the top shows each stage as a chip, in the order the signal passes through them, with arrows between. A chip reads C for a plain curve stage or D for a stage with its detector on, then Stage and its number. Init has one chip, C Stage 1.
- Click a chip to show that stage on the canvas and in the Stage card.
- Drag a chip to move the stage. A line marks where it will land.
- Right-click a chip and choose Delete stage, or press Delete while the chip has the keyboard. The last stage can’t be deleted.
- + Stage adds a stage with a straight line at the end of the chain and selects it. It is greyed out at five stages.
Order matters. A compressor followed by saturation sounds different from saturation followed by a compressor. Two of the presets, Compressor into saturation and Saturation into compressor, are that pair.
Drawing a curve
Both axes run from 0 to 1: input across, output up. In a stage without its detector, they are the size of each sample, and the curve shapes the wave’s upswings and downswings the same way. A sample louder than full scale is held at full scale before the curve. In a detector stage, they are the signal’s level going in and coming out. A straight line from bottom left to top right changes nothing. Each stage holds from 2 to 64 points.
To draw:
- Click on the curve to add a point there. The curve doesn’t change until you move it. Press on the curve and drag to add a point and move it in one go.
- Drag a point to reshape the curve. A point stays between its neighbours from left to right. The black endpoint at the bottom left slides along the left or bottom edge, and the white one at the top right along the top or right edge.
- Line points up. While you drag, a point snaps to another point’s exact height or position when it comes within 9 pixels, and a guide line shows. The same height gives a flat plateau. The same position gives a vertical step, a deliberate jump in the curve.
- Alt-click a point to change how the curve passes through it: Curve, then Linear, then Handles, then back to Curve. Curve shapes it smoothly by itself. Linear makes straight lines with a sharp corner, the mode for hard distortion corners. Handles gives the point two handles to drag, shown while it is selected.
- Right-click a point to delete it. Only the points between the two endpoints can go.
You hear a drag as you make it. When you let go, the edit becomes one undo step. Press Escape during a drag and the curve goes back to where it was. The readout at the top left gives the selected point’s in and out values and its mode.
The canvas has keys of its own once you have clicked or dragged on it. The arrow keys nudge the selected point by 0.002, or by 0.01 with Shift. Alt+Enter changes its mode, and Delete or Backspace removes it. Escape, or a click anywhere else, hands the keys back to the editor.
While sound plays and the editor is open, a dot on the curve shows where the selected stage’s input is right now. In a detector stage the gain follows the dot after its attack and release, so it can lag behind.

Input rail
| Control | Range | Init |
|---|---|---|
| Input gain | −24.0 dB to +24.0 dB | 0.0 dB |
Input gain sets the level going into the first stage. It acts on the processed path only, so it changes how hard the curves are driven, and the dry sound that Mix blends in stays as it was. It moves smoothly, over 20 ms.
The In meter beside it shows the left and right processed signal just after Input gain. It keeps working at Mix 0 %. Each channel has a CLIP cell that lights when that channel clips and stays lit until you click it: full red for a fresh clip, a dimmer red for an older one. The meter runs from −60 to 0 dBFS, green below −12, yellow up to −3 and red above, with marks and a peak cap so that it reads without the colours too. It holds a peak for 450 ms, then falls.
Out meter
The Out meter on the right of the canvas shows the real output, after the detector’s timing, Auto makeup and Mix. It works like the In meter, clip cells included.
Stage
| Control | Range | Init |
|---|---|---|
| Linked detector | Off, On | Off |
| Attack | 0.1 ms to 5000 ms | 10 ms when switched on |
| Release | 0.1 ms to 5000 ms | 120 ms when switched on |
The card is headed with the selected stage, such as Stage 1.
With Linked detector off, the stage is a waveshaper: each sample goes straight through the curve, with no memory of what came before. Switch it on and the stage turns into dynamics. The louder of the two channels is read against the curve, and the gain that comes out goes to both, so the stereo image stays put. Where the curve runs above the straight line, signal at that level is lifted; where it runs below, it is turned down. Upward gain is held to at most 16 times, about +24 dB.
Switching the detector on shows Attack and Release and sets them to 10 ms and 120 ms. Attack is how fast the gain moves towards more reduction, Release how fast it comes back after a peak falls. Both sliders are logarithmic.
None of the Stage card’s settings, nor the points, can be automated. They are saved with the project and in presets.
Output controls
| Control | Range | Init |
|---|---|---|
| Mix | 0 % to 100 % | 100 % |
| Auto makeup | Off, On | Off |
Mix is the balance of the dry sound and the processed sound. At 0 % the output is exactly the dry input, whatever Input gain is set to. Auto makeup gives back the level the curves take away. It works out how much level a full-scale sine would lose through the whole chain and makes that up, within ±24 dB, fading in or out over 20 ms. The line under it, Curve estimate, shows that figure. It is an estimate of level, not a promise of loudness.
Input gain, Mix and Auto makeup are the only three controls a host can automate.
Keys
The editor’s keyboard cursor visits two places only: the Input gain fader and the Output controls card, with Mix and Auto makeup. The canvas and the stage chips take the keys when you click them, as described above. F1 shows the keys.